kubelens: a visual map and control panel for Kubernetes
kubectl get all -A prints 800 lines, and ConfigMaps, Secrets and ServiceAccounts aren't even in them. Those 800 lines are one resource per row with nothing about how they connect, so you still don't know which Service feeds which Deployment, or which workloads share a Secret.
kubelens draws the whole cluster as one dependency graph, next to a terminal you can open many windows in. The source is on GitHub.
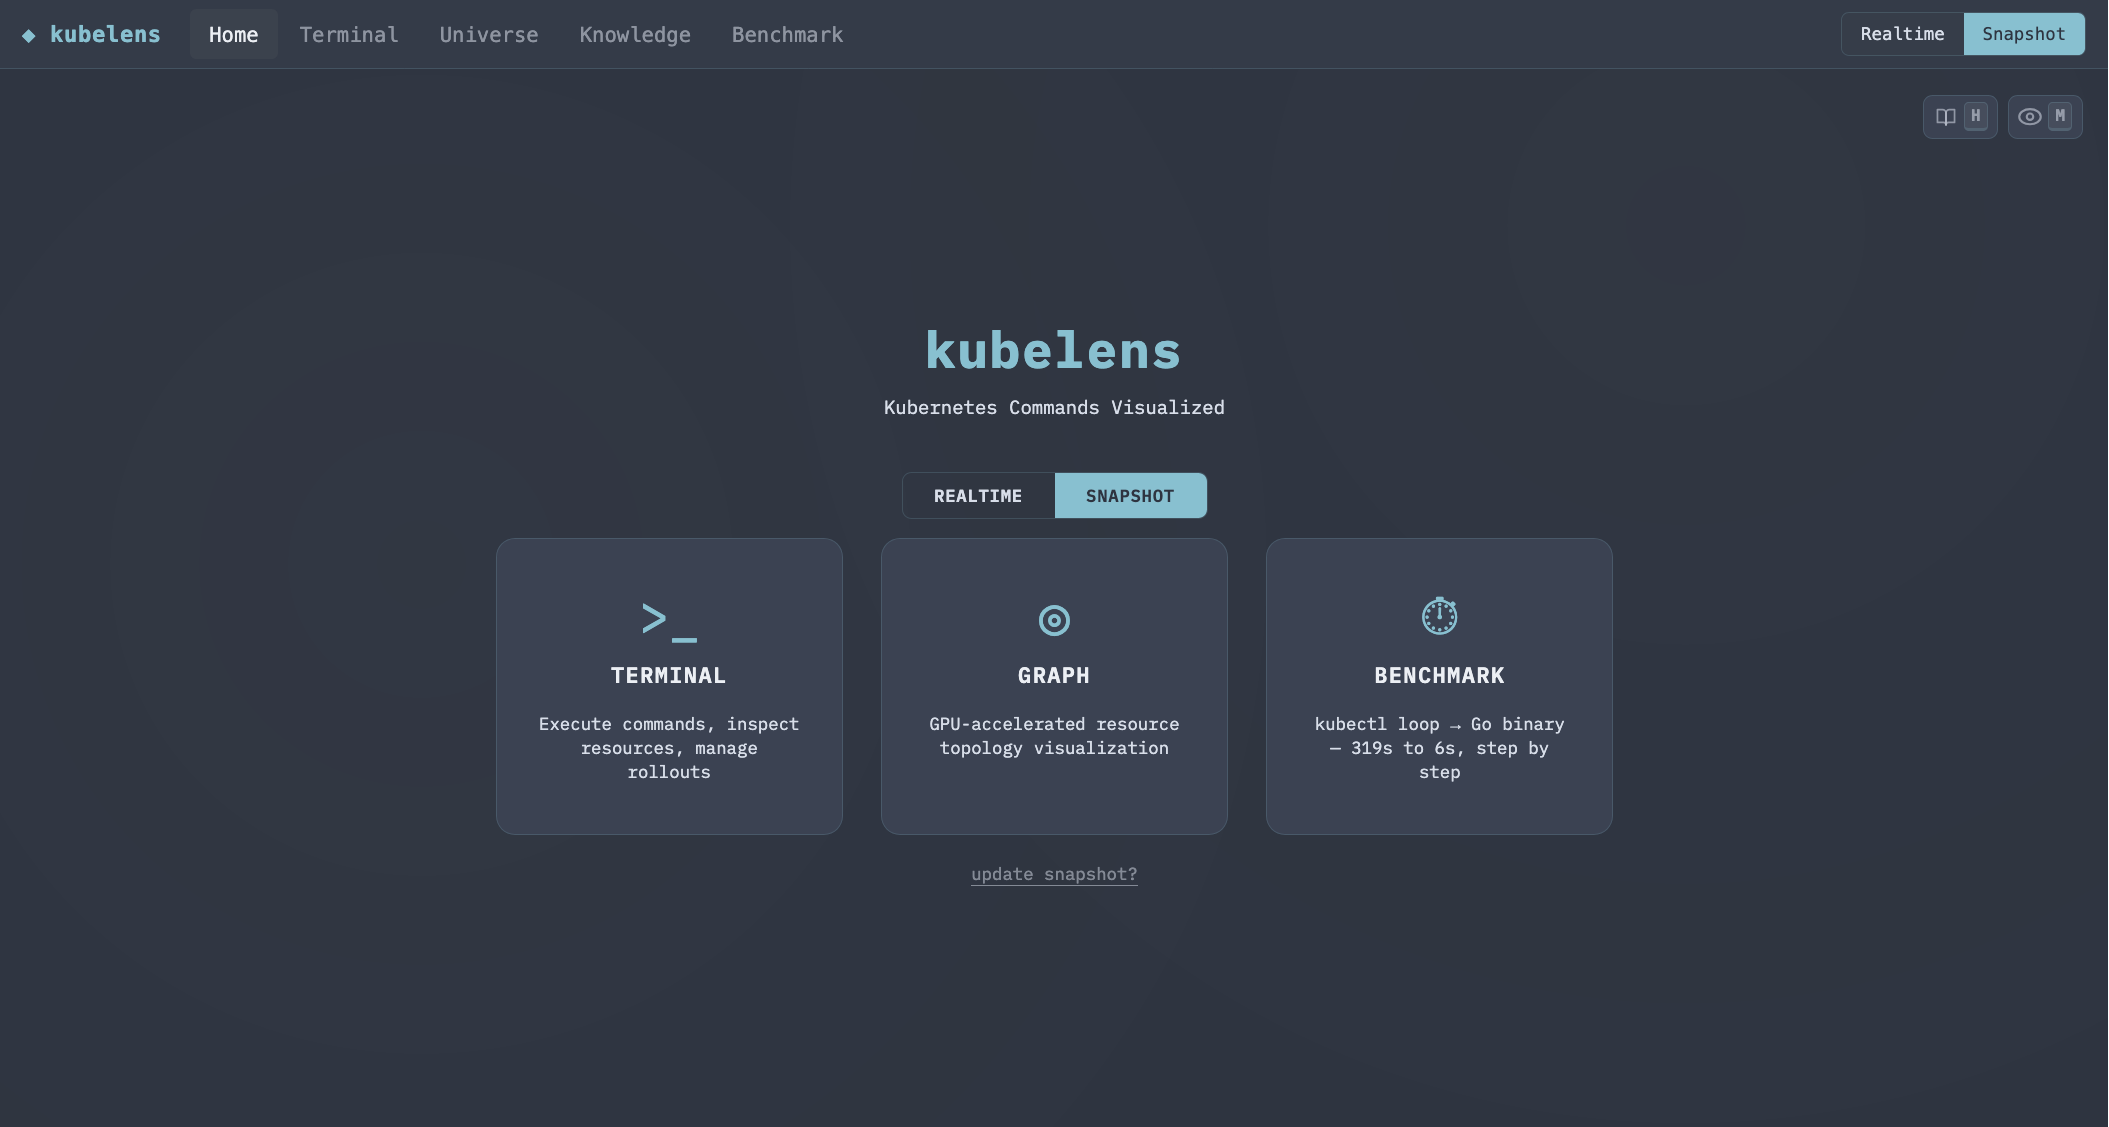
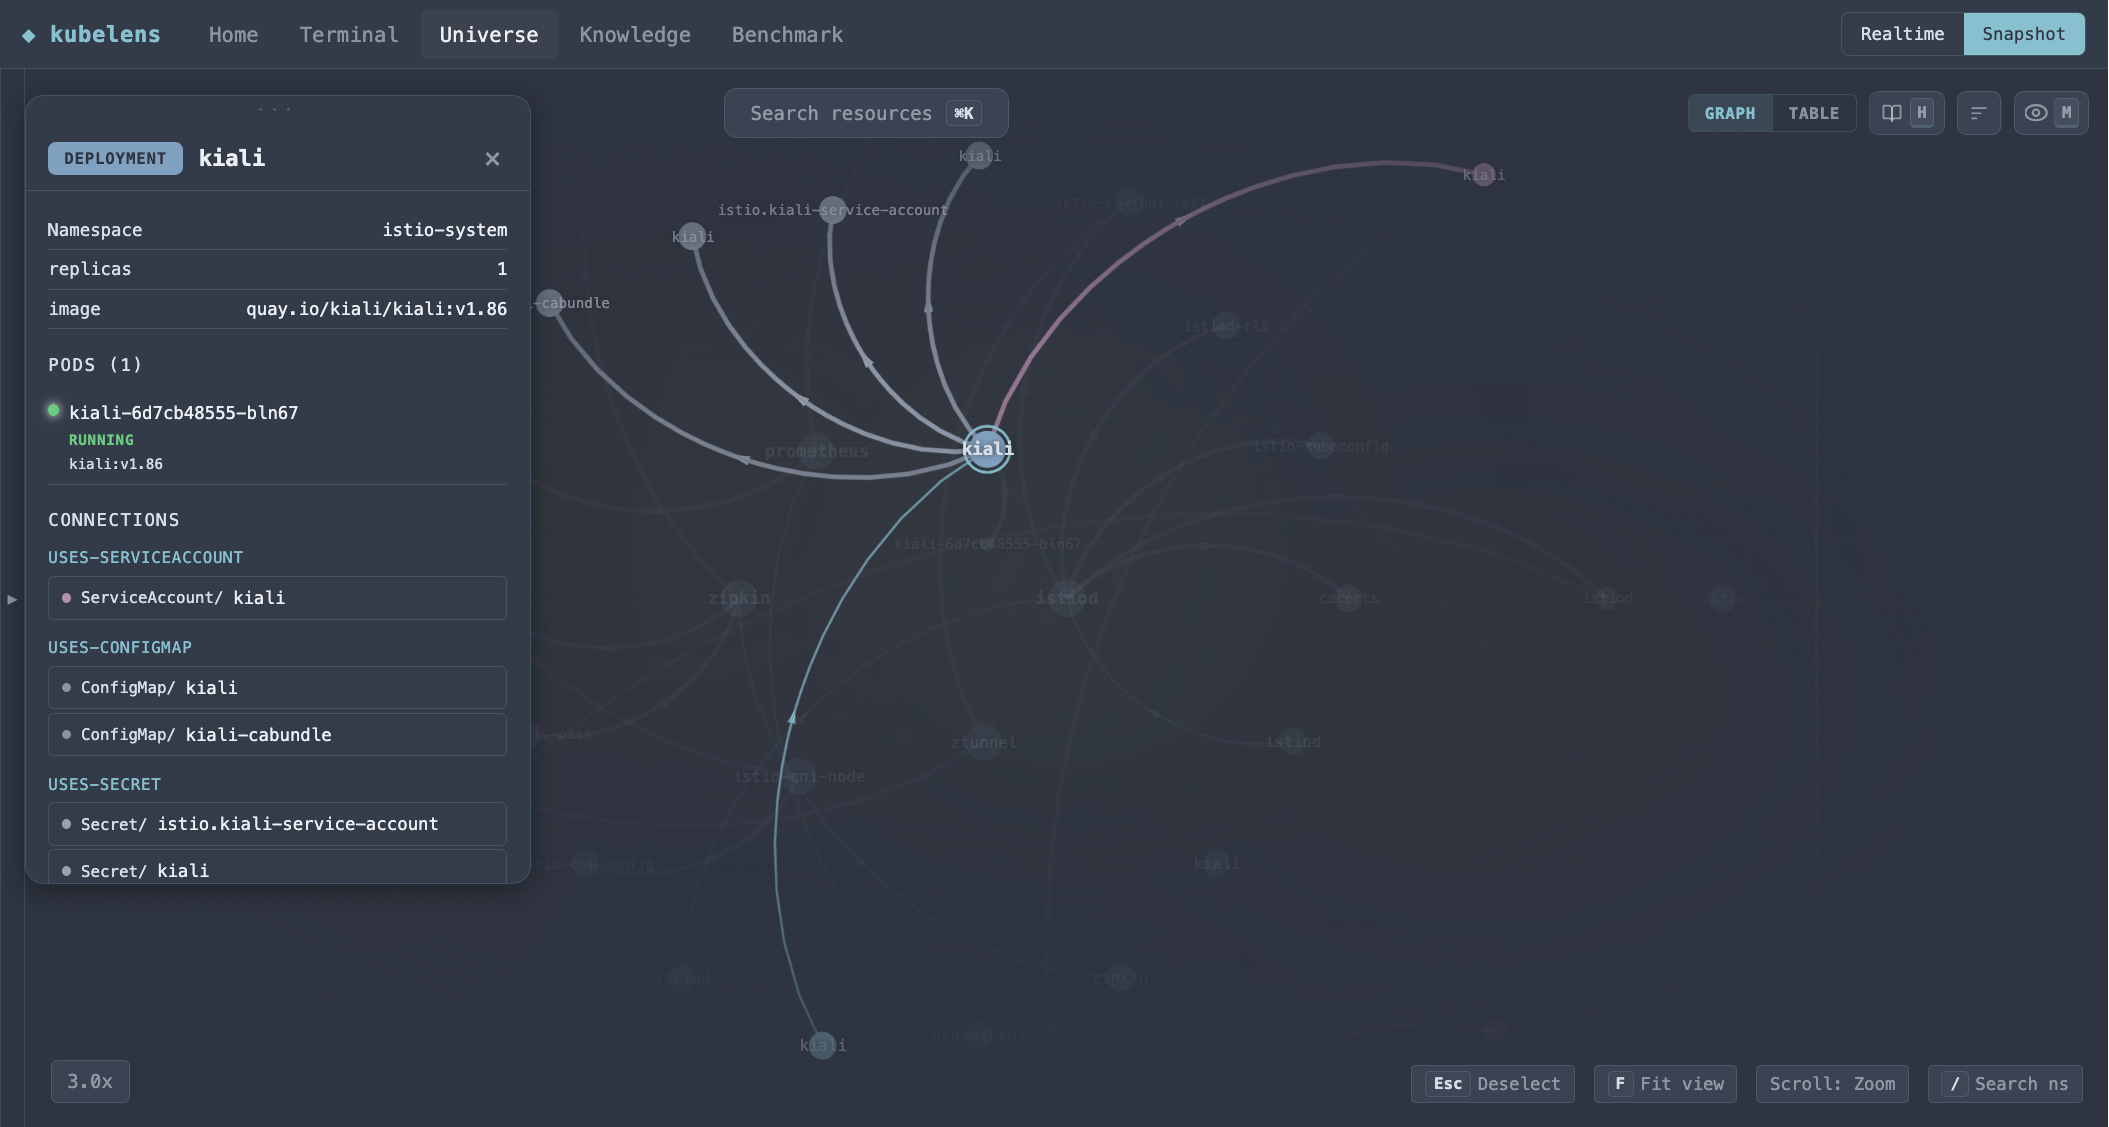
The whole cluster in one graph
820 resources across every namespace, drawn on one WebGL canvas. Every edge is a real dependency read from the specs: a Service to the Deployment it selects, an HTTPRoute to its Gateway and backend Service, a workload to the ConfigMaps, Secrets and PVCs it mounts. Click any node and the sidebar lists all of its connections.
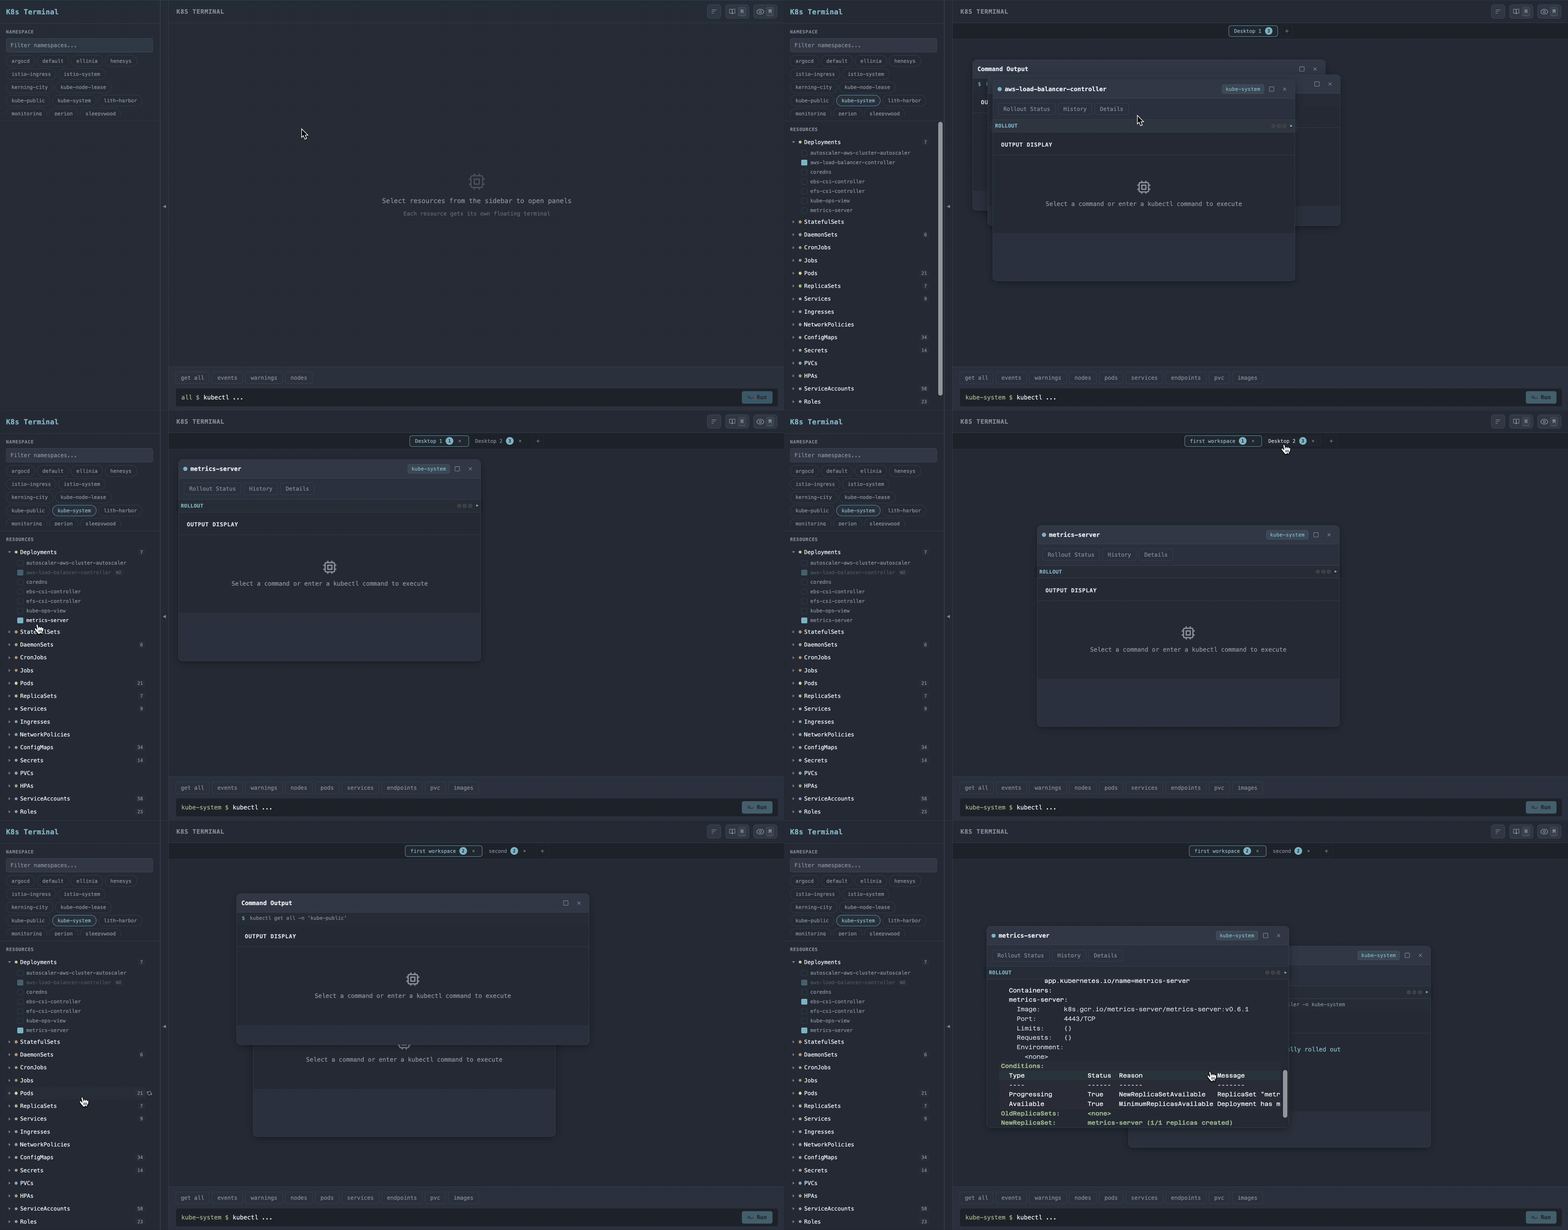
A terminal without flags to memorize
Each resource opens in its own window, and each kind gets its own buttons: a Deployment has Rollout Status and History, a Pod has Logs and the Previous Logs from before a restart, a Secret has one-click Decode. Windows sit side by side and spread across several desktops.
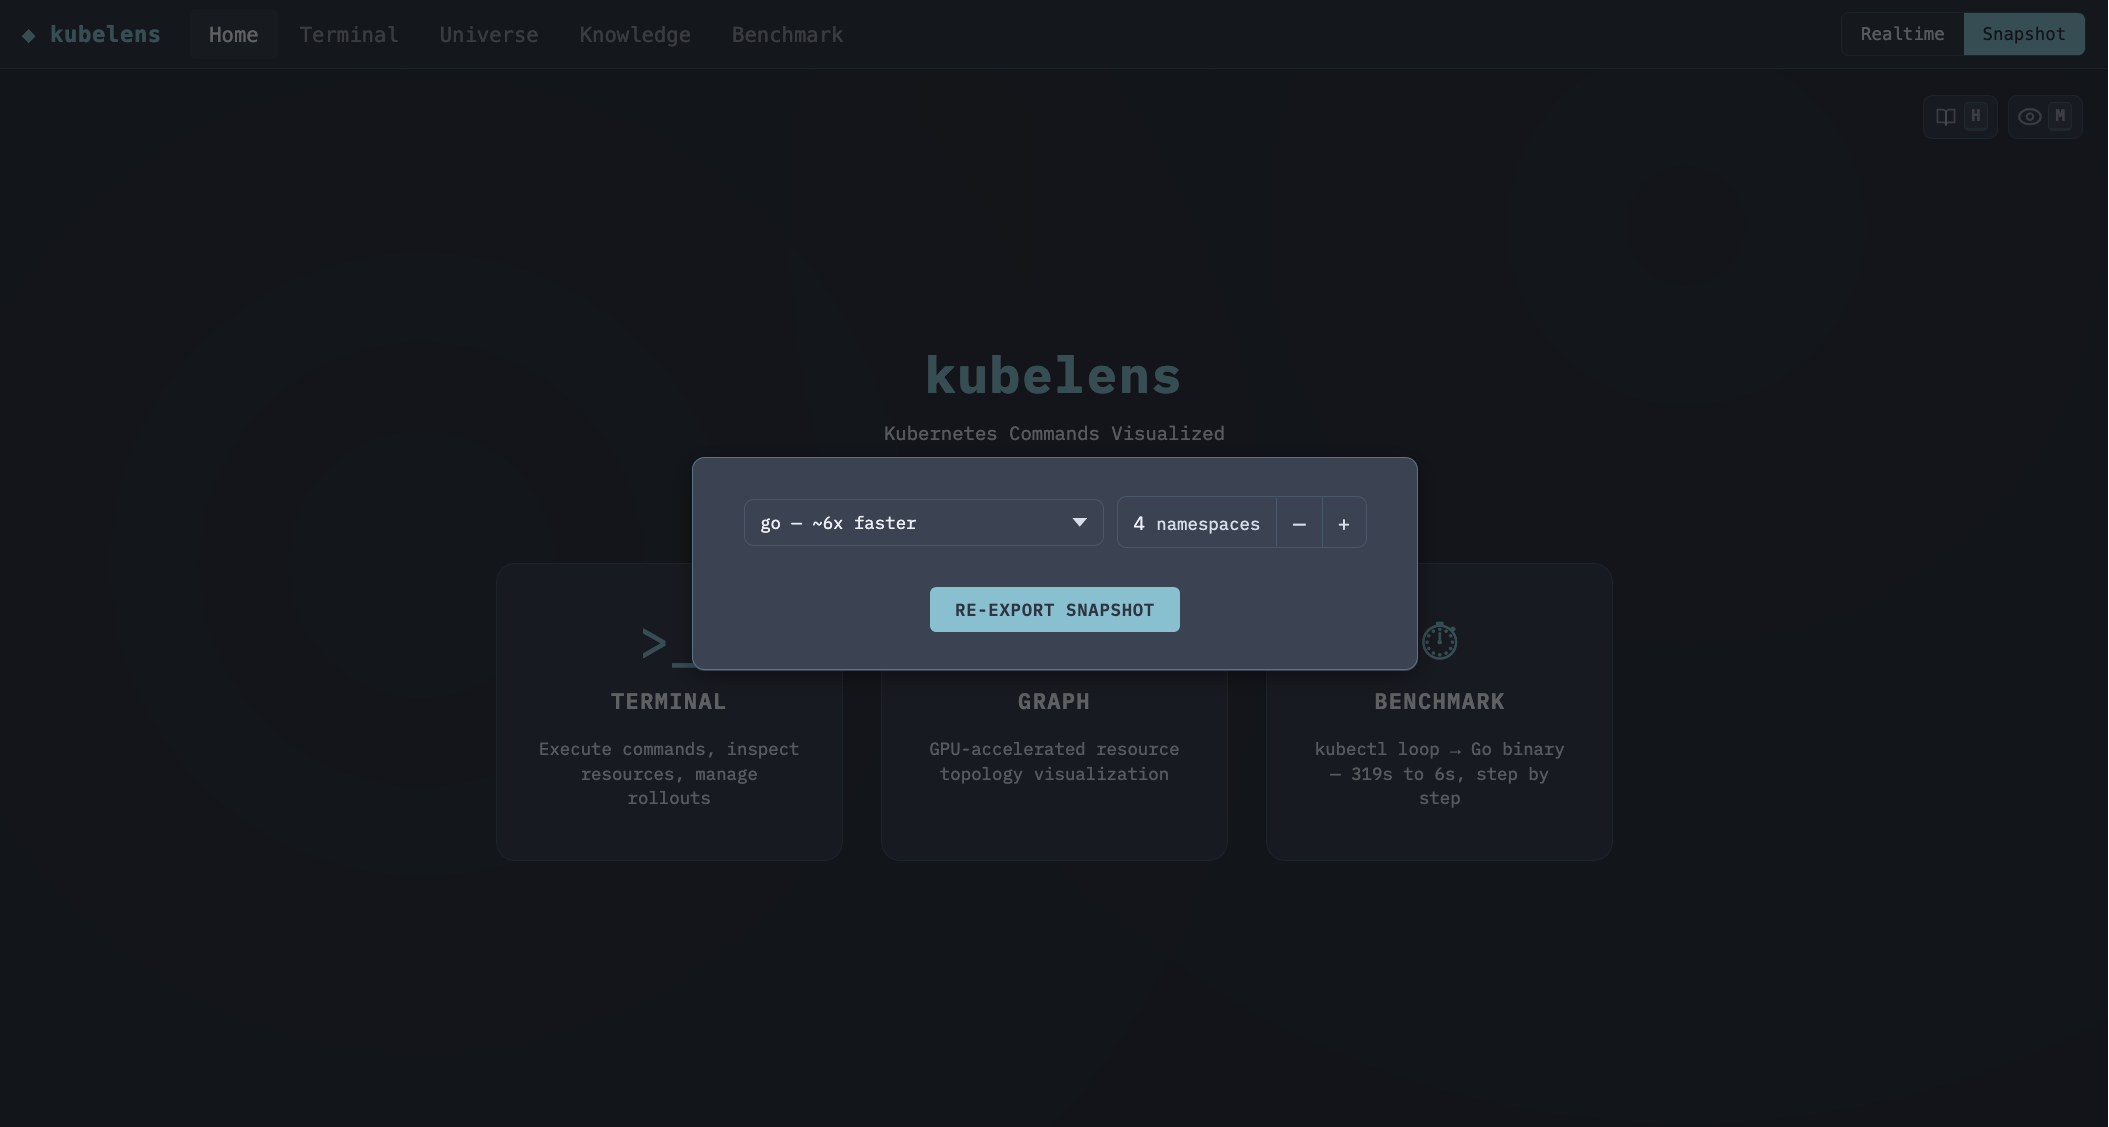
Works with the cluster off
Dev clusters shut down at night. kubelens can export the cluster to a YAML snapshot first, then draw the graph and simulate kubectl get and describe without a connection.
When to use it
For checking a single resource, kubectl or k9s in a terminal is faster. kubelens is for when you need the whole picture, or need to explain what's running to someone who doesn't know kubectl.