載入 14 KB 的 HTML 花了 1128 ms,時間去了哪裡
這個站的首頁是 14 KB 的 HTML。連 script、CSS、字型一起算,線上傳輸大約 300 KB。cold start 載入一次花了 1128 ms。哪一段花掉的?
瀏覽器有記錄。隨便開一個頁面,在 console 貼這行:
performance.getEntriesByType('navigation')[0]回來的是一個物件。下面是那次 cold start 的結果,只留時間戳,單位是毫秒,從導航開始算起:
{
  fetchStart:                   0.6,
  domainLookupStart:            0.9,
  domainLookupEnd:             74.2,
  connectStart:                74.2,
  secureConnectionStart:      226.2,
  connectEnd:                 287.9,
  requestStart:               288.0,
  responseStart:              522.7,
  responseEnd:                523.0,
  domInteractive:             889.9,
  domContentLoadedEventStart: 889.9,
  domContentLoadedEventEnd:   890.6,
  domComplete:               1127.6,
  loadEventStart:            1127.7,
  loadEventEnd:              1127.8,
  duration:                  1127.8,
  transferSize:                4076,
  decodedBodySize:            14187,
  nextHopProtocol:             "h2",
}
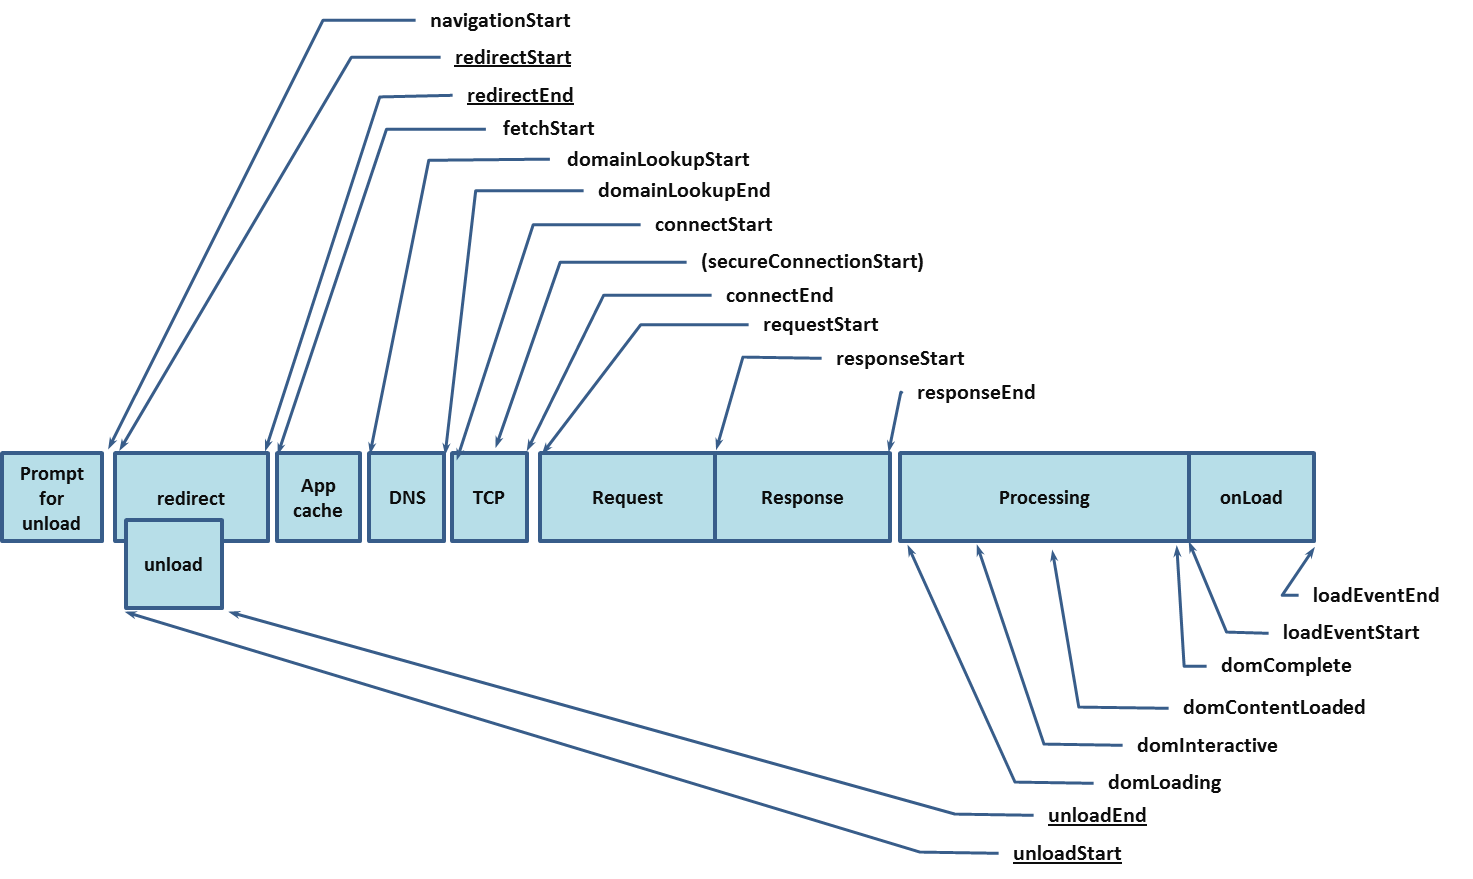
這個物件的格式來自 W3C 的 Navigation Timing Level 2(Working Draft,2026-09-01 這版),API 名字是 PerformanceNavigationTiming。下面 iframe 重畫的那張 Navigation Timing 原圖來自第一版 Level 1(W3C Recommendation,2012-12-17),圖檔在 spec 的 Processing Model 那節,API 是 performance.timing,MDN 已經標 deprecated。兩版的欄位名字大多一樣,差在起點怎麼算,還有 Level 2 少了幾個欄位,文末有對照。
這些名字不用背。它們兩兩成對,每一對就是一個階段的頭和尾。unload 跟 redirect 這次都是 0,App cache 是 0.3 ms(fetchStart 0.6 到 domainLookupStart 0.9),寬度畫不出來,所以從 DNS 開始畫:
0.9      74       226     288      523              890               1128
|  DNS   |  TCP   |  TLS  | Request |   parse HTML   |  subresources   |
^        ^        ^       ^         ^                ^                 ^
lookup   connect  secure  request   responseStart    domInteractive    domComplete
Start    Start    Conn.   Start     responseEnd      DCL start + end   loadEventEnd
                  Start             (差 0.3 ms)      (差 0.7 ms)
尾減頭,就是那個階段等了多久。原圖的每個格子都在下面,包括這次是 0 的:
| 階段 | 減法 | 這次 | 瀏覽器在等什麼 |
|---|---|---|---|
| Prompt for unload | Level 2 沒有時間戳 | 上一頁的 beforeunload 對話框 | |
| unload | unloadEventEnd − unloadEventStart | 0 ms | 上一頁的 unload handler。上一頁跟這一頁同源才有值,不同源是 0(MDN) |
| redirect | redirectEnd − redirectStart | 0 ms | 到最終網址之前的 HTTP redirect。Chrome 自己把 http 升級成 https 的不算,我量到的 redirectCount 是 0 |
| App cache | domainLookupStart − fetchStart | 0.3 ms | 查詢 HTTP cache。fetchStart 取在查 cache 之前(spec),命中的話 fetch 到這裡就結束 |
| DNS | domainLookupEnd − domainLookupStart | 73 ms | 網域名稱換成 IP |
| TCP | secureConnectionStart − connectStart | 152 ms | 一個 round trip,把 socket 開起來 |
| TLS | connectEnd − secureConnectionStart | 62 ms | 交換憑證。secureConnectionStart 取在 TLS 握手開始之前,純 http 是 0(MDN) |
| Request | responseStart − requestStart | 235 ms | 伺服器送出第一個 byte(TTFB)。responseStart 取在收到第一個 byte 之後(MDN) |
| Response | responseEnd − responseStart | 0.3 ms | 剩下的 byte 傳完 |
| Parse | domInteractive − responseEnd | 367 ms | HTML parser,以及每一個讓 parser 停下來的 script。domInteractive 取在 readyState 變成 interactive 之前(MDN) |
| Deferred scripts | domContentLoadedEventStart − domInteractive | 0 ms | <script defer> 跑完。DOMContentLoaded 會等 defer 的 script,不等 async 的(MDN) |
| DOMContentLoaded | domContentLoadedEventEnd − domContentLoadedEventStart | 0.7 ms | 你的 DOMContentLoaded handler |
| Subresources | domComplete − domContentLoadedEventEnd | 237 ms | 圖片、字型、iframe、async script。load 要等這些全部到齊(MDN) |
| onload | loadEventEnd − loadEventStart | 0.1 ms | 你的 load handler |
有值的十三列互不重疊,相加就是總時間。網路(redirect 到 Response)522 ms,處理(Parse 到 onload)605 ms,再加 startTime 到 fetchStart 之間的 0.6 ms,合計 1128 ms。14 KB 的 HTML 本身是 Response,0.3 ms。
上面的數字是我的電腦載入一次的結果。下面這張是 Navigation Timing 的原圖,十個格子跟二十一個時間戳都在,只是數字換成你現在看的這一頁自己的載入,從這一頁自己的 entry 讀出來。這個 iframe 本身也是這一頁的 subresource,所以 Processing 跟 Subresources 都把載入 iframe 的時間算進去了:
每個階段的 blocking issue
每一段慢的原因不同,修法也不同。
- unload、redirect、App cache:這個站上一直是 0。unload 只有上一頁同源才有值,redirect 要真的經過 HTTP 301 或 302 才有,App cache 是查詢 HTTP cache 的時間,命中的話後面 DNS 到 Response 全部是 0。Chrome 從 2023 年起會自己把
http://升級成https://(Chromium Blog),我用http://量這個站,redirectCount 還是 0。 - DNS:沒有任何 cache 有答案。我跑了五次 cold start,每次都是新的瀏覽器 profile 加新的 disk cache。DNS 第一次 73 ms,後四次 0。答案第一次查到之後就進了作業系統的 resolver cache,換瀏覽器 profile 清不掉作業系統的 resolver cache。
- TCP:伺服器離得遠。一個 round trip 是下限,程式碼省不掉,CDN 可以讓端點離使用者近一點。
- TLS:TLS 版本舊,或者連線沒有被重用。HTTP/1.1 預設就把連線留著給下一個 request 用(MDN),HTTP/2 和 HTTP/3 一條連線多工,所以 TLS 每個 origin 出現一次,不是每一頁一次。
- Request:伺服器在工作。靜態檔的話是 CDN cache miss,server render 的話是你的 render function。rendering strategy 改變的就是 Request。static export 加 CDN 讓 Request 變小,server render 讓 Request 變成整排裡最長的。
- Response:HTML 太大,或者沒壓縮。拿
transferSize跟decodedBodySize比一下。這裡線上 4 KB 解開是 14 KB,壓縮有開。 - Parse:同步 script 太多。沒有
defer也沒有async的<script>會讓 parser 停下來,等它下載完、跑完(MDN)。Parse 結束在domInteractive,React 也要等到domInteractive才能 mount,所以 Parse 多長,app 就多晚開始。接下來從 DOM 到像素的部分,另一篇在講。 - Deferred scripts:
<script defer>在 parse 完之後、DOMContentLoaded之前執行,而且DOMContentLoaded會等它(MDN)。這個站的 chunk 用async載入,async不會拖住DOMContentLoaded,所以 Deferred scripts 在這裡是 0。要是一個站把大 bundle 標成 defer,bundle 執行的時間就會出現在 Deferred scripts。 - Subresources:頁面在等圖片、字型、iframe、async script 都到齊才發
load。這個站的文章頁五次 cold start 裡,Subresources 是 496 到 909 ms,因為文章頁嵌了兩個 iframe,load兩個都要等。
五次 cold start,加一次 reload
每次 cold start 都是我筆電上新開的 headless Chrome 153,新 profile、新 disk cache,導航一次。reload 是同一個瀏覽器裡,緊接著再對同一個網址導航一次。
| 階段 | 首頁,cold start ×5 | 文章頁,cold start ×5 | 首頁,reload |
|---|---|---|---|
| DNS | 0 到 73 ms | 0 到 1 ms | 0 |
| TCP + TLS | 124 到 214 ms | 115 到 167 ms | 0 |
| Request(TTFB) | 49 到 235 ms | 50 到 244 ms | 0.1 ms |
| Response | 0.3 ms | 14 到 19 ms | 0.3 ms |
| Parse | 198 到 424 ms | 221 到 356 ms | 6 ms |
| Subresources | 125 到 237 ms | 496 到 909 ms | 7 ms |
| 合計 | 555 到 1128 ms | 939 到 1677 ms | 14 ms |
| HTML 線上 bytes | 4076 B | 28585 B | 0 |
reload 欄的 transferSize 是 0,MDN 說 transferSize 是 0 而 decodedBodySize 不是 0,就代表從本機 cache 拿的(MDN)。HTML 沒走網路,DNS 到 Response 全部是 0,整次載入 14 ms。文章頁的 TCP 和 TLS 跟首頁差不多,多出來的時間都在 Subresources,在等它的 iframe。同一欄裡面的差距跟欄與欄之間的差距一樣大,首頁的 TTFB 從 49 ms 到 235 ms,中間什麼都沒改,只是換了一次跑。跑一次知道哪一段大,跑五次才知道欄與欄的差距有沒有超過雜訊。
量測腳本
Node 22、macOS、Chrome 裝在預設路徑。每次都新開一個 Chrome,新 profile、新 disk cache,導航一次,load 之後把 entry 讀出來。
// node cold.mjs <url> <runs>
import { spawn } from 'node:child_process'
import { mkdtempSync } from 'node:fs'
import { tmpdir } from 'node:os'
import { join } from 'node:path'

const [url, runsArg] = process.argv.slice(2)
const sleep = ms => new Promise(r => setTimeout(r, ms))

async function once(port) {
  const profile = mkdtempSync(join(tmpdir(), 'chrome-prof-'))
  const cache = mkdtempSync(join(tmpdir(), 'chrome-cache-'))
  const chrome = spawn('/Applications/Google Chrome.app/Contents/MacOS/Google Chrome', [
    '--headless=new', `--remote-debugging-port=${port}`,
    `--user-data-dir=${profile}`, `--disk-cache-dir=${cache}`,
    '--no-first-run', 'about:blank',
  ], { stdio: 'ignore' })

  let targets
  for (let i = 0; i < 40; i++) {
    await sleep(250)
    try { targets = await (await fetch(`http://127.0.0.1:${port}/json`)).json(); break } catch {}
  }
  const ws = new WebSocket(targets.find(t => t.type === 'page').webSocketDebuggerUrl)
  await new Promise(r => ws.onopen = r)
  let id = 0
  const pending = new Map()
  ws.onmessage = e => { const m = JSON.parse(e.data); if (pending.has(m.id)) { pending.get(m.id)(m); pending.delete(m.id) } }
  const send = (method, params = {}) => new Promise(r => { pending.set(++id, r); ws.send(JSON.stringify({ id, method, params })) })

  await send('Page.enable')
  await send('Page.navigate', { url })
  let entry
  for (let i = 0; i < 120; i++) {
    await sleep(250)
    const r = await send('Runtime.evaluate', { returnByValue: true,
      expression: `JSON.stringify(performance.getEntriesByType('navigation')[0]?.toJSON() ?? null)` })
    entry = JSON.parse(r.result.result.value)
    if (entry && entry.loadEventEnd > 0) break
  }
  ws.close()
  chrome.kill()
  return entry
}

const all = []
for (let i = 0; i < Number(runsArg || 5); i++) all.push(await once(9400 + i))
console.log(JSON.stringify(all))
Level 1 有三個事件在 Level 2 沒有
- navigationStart:原圖最左邊的起點。Level 2 的 spec 在這個屬性下面直接寫「
PerformanceNavigationTiming沒有定義它,改用timeOrigin」(spec)。原因是 Level 2 換了時鐘。Level 1 的performance.timing每個值都是從 1970 年算起的絕對毫秒數,要知道一段花多久,得先拿兩個值相減。Level 2 改用 HR-TIME 的DOMHighResTimeStamp,每個值都是從 time origin 起算的相對時間,time origin 就是導航開始那一刻(hr-time)。W3C 給的理由有兩個:Date.now()那種絕對時間在系統時鐘被調整時會倒退,精度也只到毫秒;相對時間用單調時鐘,不會倒退,有毫秒以下的精度。所以 navigationStart 沒有消失,它變成startTime的 0,其他名字沒變。 - domLoading:Level 1 用來標 parser 開始的時刻。2015 年 w3c/navigation-timing 的 issue #13 提出拿掉:Chrome 在 response 開始之前就建立 Document,IE 在 response 開始的時候,Firefox 要先 buffer 一段 response 才建,所以 domLoading 量到的是各家瀏覽器內部實作的時間點,對頁面作者沒有用。結果是 spec 加了一條 deprecation note,「因為各 user agent 建立 Document 的時間點不同,domLoading 的值是 implementation specific,不應該用在有意義的指標上」(spec),
PerformanceNavigationTiming就沒放它。最接近的值是responseEnd。 - Prompt for unload:離開上一頁之前跳出來的
beforeunload對話框。Level 1 把navigationStart定義在「問完要不要離開上一頁之後」(spec),Level 2 的 time origin 也是導航開始那一刻,對話框在時鐘開始之前,所以兩版都沒有它的時間戳。Level 1 的圖畫這個格子,只是標出起點前面發生了什麼。
fetchStart 本身取在查詢 HTTP cache 之前,startTime 到 fetchStart 之間是 unload 跟 redirect,這次是 0.6 ms。
參考
- Navigation Timing,W3C Recommendation,2012-12-17。Level 1,原圖的出處,圖檔是 timing-overview.png。
- Navigation Timing Level 2,W3C Working Draft。現在的 spec,processing model 那節定義每個時間戳在哪一刻取。
- PerformanceNavigationTiming,MDN。每個屬性,附一張它們發生順序的圖。
- Performance.timing,MDN。已經 deprecated 的 Level 1 介面,讀舊圖的時候對照用。
- The script element,MDN。沒有屬性、
async、defer三種 script 各在哪一刻執行。 - Towards HTTPS by default,Chromium Blog,2023-08-16。Chrome 自動把 http 升級成 https 的公告。
- Measure the Critical Rendering Path,web.dev。同一組減法,用在第一次 render 上。