1128 ms to load 14 KB of HTML. Where did it go?
The home page of this site is 14 KB of HTML. With its scripts, styles and fonts it is about 300 KB on the wire. A cold start took 1128 ms. Which stage took the time?
The browser already knows. Paste this into the console of any page:
performance.getEntriesByType('navigation')[0]It returns one object. Here is the one from that cold start, trimmed to the timestamps, all in milliseconds from the moment the navigation started:
{
  fetchStart:                   0.6,
  domainLookupStart:            0.9,
  domainLookupEnd:             74.2,
  connectStart:                74.2,
  secureConnectionStart:      226.2,
  connectEnd:                 287.9,
  requestStart:               288.0,
  responseStart:              522.7,
  responseEnd:                523.0,
  domInteractive:             889.9,
  domContentLoadedEventStart: 889.9,
  domContentLoadedEventEnd:   890.6,
  domComplete:               1127.6,
  loadEventStart:            1127.7,
  loadEventEnd:              1127.8,
  duration:                  1127.8,
  transferSize:                4076,
  decodedBodySize:            14187,
  nextHopProtocol:             "h2",
}
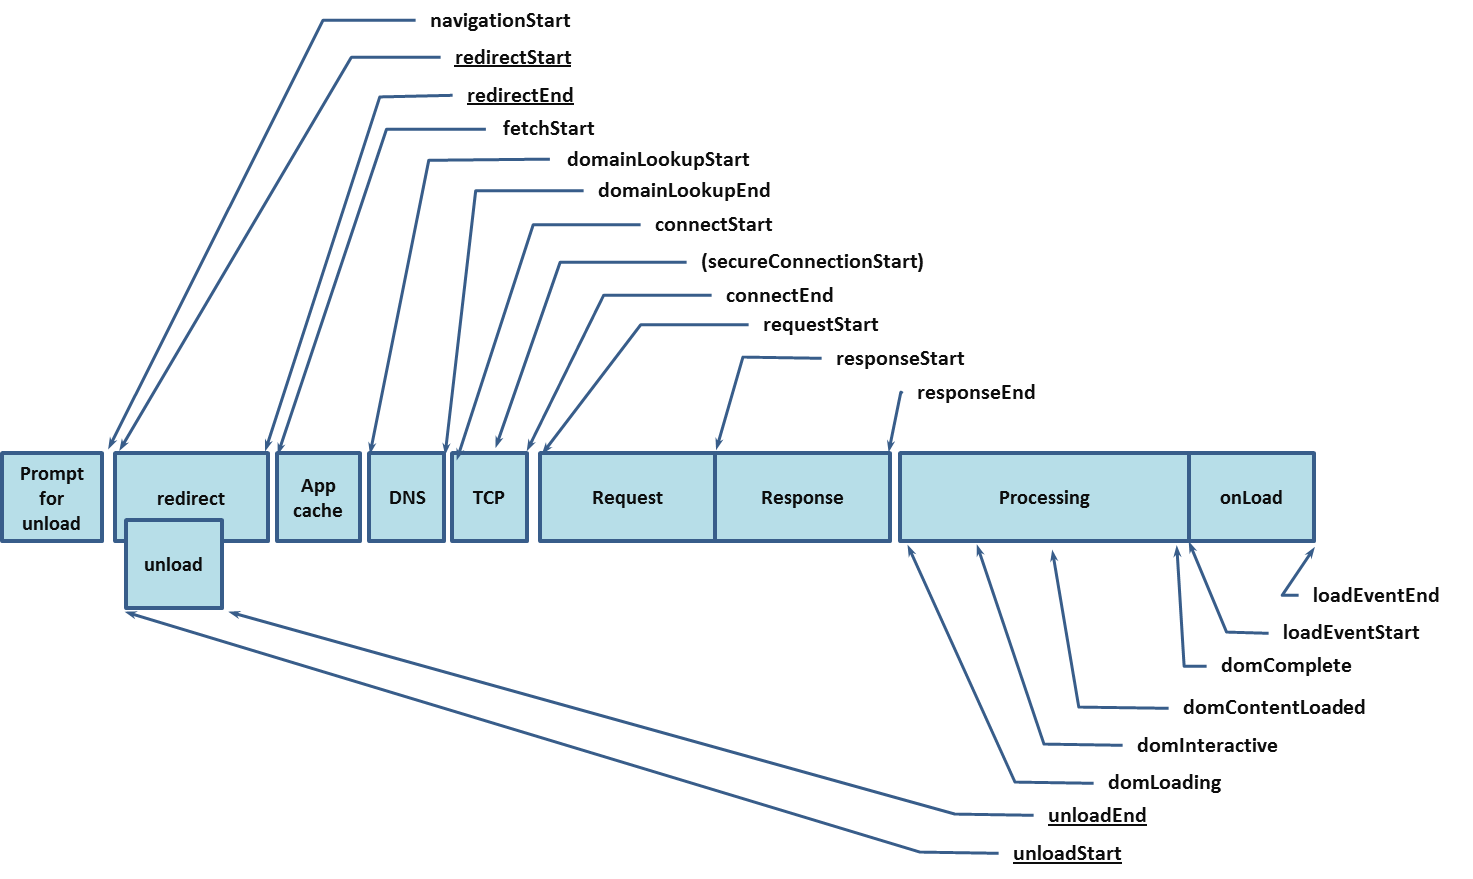
This object follows the W3C spec Navigation Timing Level 2 (Working Draft, this revision dated 2026-09-01); the API is PerformanceNavigationTiming. The Navigation Timing diagram redrawn in the iframe below comes from the first version, Level 1 (W3C Recommendation, 2012-12-17), in its Processing Model section; its API is performance.timing, now marked deprecated on MDN. Most field names are the same in both. The differences are where the clock starts and a few fields Level 2 dropped, listed at the end.
Nobody memorises these names. They come in pairs, and each pair is the two ends of one stage. unload and redirect were 0 on this load and App cache was 0.3 ms (fetchStart 0.6 to domainLookupStart 0.9), too narrow to draw, so the picture starts at DNS:
0.9      74       226     288      523              890               1128
|  DNS   |  TCP   |  TLS  | Request |   parse HTML   |  subresources   |
^        ^        ^       ^         ^                ^                 ^
lookup   connect  secure  request   responseStart    domInteractive    domComplete
Start    Start    Conn.   Start     responseEnd      DCL start + end   loadEventEnd
                  Start             (0.3 ms apart)   (0.7 ms apart)
Subtract the two ends and you get how long that stage waited. Every box of the original diagram is below, including the ones that were 0 this time:
| Stage | Subtraction | This load | What the browser is waiting for |
|---|---|---|---|
| Prompt for unload | no Level 2 timestamp | the previous page's beforeunload dialog | |
| unload | unloadEventEnd − unloadEventStart | 0 ms | the previous page's unload handlers. Set only when that page was on the same origin, 0 otherwise (MDN) |
| redirect | redirectEnd − redirectStart | 0 ms | HTTP redirects before the final URL. Chrome upgrading http to https on its own does not count; I measured redirectCount 0 |
| App cache | domainLookupStart − fetchStart | 0.3 ms | the HTTP cache check. fetchStart is taken just before that check (spec); a hit ends the fetch here |
| DNS | domainLookupEnd − domainLookupStart | 73 ms | the domain name to become an IP address |
| TCP | secureConnectionStart − connectStart | 152 ms | one round trip to open the socket |
| TLS | connectEnd − secureConnectionStart | 62 ms | the certificate exchange. secureConnectionStart is taken just before the TLS handshake, 0 on plain http (MDN) |
| Request | responseStart − requestStart | 235 ms | the server to send the first byte (TTFB). responseStart is taken right after the first byte arrives (MDN) |
| Response | responseEnd − responseStart | 0.3 ms | the rest of the bytes |
| Parse | domInteractive − responseEnd | 367 ms | the HTML parser, and every script that blocks it. domInteractive is taken just before readyState becomes interactive (MDN) |
| Deferred scripts | domContentLoadedEventStart − domInteractive | 0 ms | <script defer> to run. DOMContentLoaded waits for deferred scripts, not async ones (MDN) |
| DOMContentLoaded | domContentLoadedEventEnd − domContentLoadedEventStart | 0.7 ms | your DOMContentLoaded handlers |
| Subresources | domComplete − domContentLoadedEventEnd | 237 ms | images, fonts, iframes, async scripts. load waits for all of them (MDN) |
| onload | loadEventEnd − loadEventStart | 0.1 ms | your load handlers |
The thirteen rows with a value do not overlap, so they add up: 522 ms of network (redirect through Response), 605 ms of processing (Parse through onload), plus 0.6 ms between startTime and fetchStart, 1128 ms in total. The 14 KB of HTML itself is the Response row, 0.3 ms.
That was one load on my machine. Below is the Navigation Timing diagram itself, all ten boxes and all twenty one timestamps, with the numbers replaced by the load you are looking at right now, read from this page's own entry. This iframe is itself one of the page's subresources, so Processing and Subresources both include the time it took to load the iframe:
Each stage's blocking issue
Each stage waits on a different thing, so each one points at a different fix.
- unload, redirect, App cache: always 0 on this site. unload is set only when the previous page was on the same origin, redirect needs a real HTTP 301 or 302, and App cache is the HTTP cache check; on a hit, DNS through Response all become 0. Chrome has upgraded
http://navigations tohttps://on its own since 2023 (Chromium Blog); loading this site overhttp://still gave redirectCount 0. - DNS: nothing had the answer cached. I ran five cold starts, each in a fresh browser profile with a fresh disk cache. DNS was 73 ms in the first and 0 in the other four. Once the first lookup answered, the answer sat in the operating system's resolver cache, and a fresh browser profile does not clear the operating system's resolver cache.
- TCP: the server is far away. One round trip is the floor, and no code removes it. A CDN moves the endpoint closer.
- TLS: old TLS version, or a connection that is not being reused. HTTP/1.1 keeps the connection open for the next request by default (MDN), and HTTP/2 and HTTP/3 multiplex one connection, so TLS shows once per origin, not once per page.
- Request: the server is working. For a static file this is the CDN's cache miss; for server rendering it is your render function. This is the stage that rendering strategy changes: static export and CDN make Request small, server render makes Request the longest box on the row.
- Response: the HTML is large, or not compressed. Check
transferSizeagainstdecodedBodySize. Here 4 KB on the wire became 14 KB, so compression is on. - Parse: too much synchronous script. A
<script>withoutdeferorasyncstops the parser until it has downloaded and run (MDN). Parse ends atdomInteractive, and React cannot mount beforedomInteractive, so the length of Parse sets when the app starts. What happens next, from DOM to pixels, is its own article. - Deferred scripts:
<script defer>runs after parsing and beforeDOMContentLoaded, andDOMContentLoadedwaits for it (MDN). This site loads its chunks withasync, which does not holdDOMContentLoaded, so Deferred scripts is 0 here. A site that defers a large bundle sees the bundle's run time in Deferred scripts. - Subresources: the page is waiting on images, fonts, iframes and async scripts before it will fire
load. The article page on this site spent 496 to 909 ms in Subresources across five cold starts. It embeds two iframes, andloadwaits for both.
Five cold starts, and one reload
Each cold start is a fresh headless Chrome 153 on my laptop, fresh profile, fresh disk cache, one navigation. The reload is a second navigation to the same URL in the same browser, right after the first.
| Stage | Home page, cold start ×5 | Article page, cold start ×5 | Home page, reload |
|---|---|---|---|
| DNS | 0 to 73 ms | 0 to 1 ms | 0 |
| TCP + TLS | 124 to 214 ms | 115 to 167 ms | 0 |
| Request (TTFB) | 49 to 235 ms | 50 to 244 ms | 0.1 ms |
| Response | 0.3 ms | 14 to 19 ms | 0.3 ms |
| Parse | 198 to 424 ms | 221 to 356 ms | 6 ms |
| Subresources | 125 to 237 ms | 496 to 909 ms | 7 ms |
| Total | 555 to 1128 ms | 939 to 1677 ms | 14 ms |
| HTML on the wire | 4076 B | 28585 B | 0 |
The reload has transferSize: 0, and MDN reads a transferSize of 0 with a nonzero decodedBodySize as a local cache hit (MDN). The HTML never touched the network, DNS through Response are all 0, and the whole load is 14 ms. The article page has the same TCP and TLS cost as the home page and spends its extra time in Subresources, waiting for its iframes. The spread inside one column is as wide as the difference between columns: TTFB on the home page went from 49 ms to 235 ms with nothing changed but the run. One load tells you which stage is big. Five tell you whether the gap between columns is bigger than the noise.
The measurement script
Node 22, macOS, Chrome installed at the default path. Each run starts a fresh Chrome with a fresh profile and disk cache, navigates once, and reads the entry after load.
// node cold.mjs <url> <runs>
import { spawn } from 'node:child_process'
import { mkdtempSync } from 'node:fs'
import { tmpdir } from 'node:os'
import { join } from 'node:path'

const [url, runsArg] = process.argv.slice(2)
const sleep = ms => new Promise(r => setTimeout(r, ms))

async function once(port) {
  const profile = mkdtempSync(join(tmpdir(), 'chrome-prof-'))
  const cache = mkdtempSync(join(tmpdir(), 'chrome-cache-'))
  const chrome = spawn('/Applications/Google Chrome.app/Contents/MacOS/Google Chrome', [
    '--headless=new', `--remote-debugging-port=${port}`,
    `--user-data-dir=${profile}`, `--disk-cache-dir=${cache}`,
    '--no-first-run', 'about:blank',
  ], { stdio: 'ignore' })

  let targets
  for (let i = 0; i < 40; i++) {
    await sleep(250)
    try { targets = await (await fetch(`http://127.0.0.1:${port}/json`)).json(); break } catch {}
  }
  const ws = new WebSocket(targets.find(t => t.type === 'page').webSocketDebuggerUrl)
  await new Promise(r => ws.onopen = r)
  let id = 0
  const pending = new Map()
  ws.onmessage = e => { const m = JSON.parse(e.data); if (pending.has(m.id)) { pending.get(m.id)(m); pending.delete(m.id) } }
  const send = (method, params = {}) => new Promise(r => { pending.set(++id, r); ws.send(JSON.stringify({ id, method, params })) })

  await send('Page.enable')
  await send('Page.navigate', { url })
  let entry
  for (let i = 0; i < 120; i++) {
    await sleep(250)
    const r = await send('Runtime.evaluate', { returnByValue: true,
      expression: `JSON.stringify(performance.getEntriesByType('navigation')[0]?.toJSON() ?? null)` })
    entry = JSON.parse(r.result.result.value)
    if (entry && entry.loadEventEnd > 0) break
  }
  ws.close()
  chrome.kill()
  return entry
}

const all = []
for (let i = 0; i < Number(runsArg || 5); i++) all.push(await once(9400 + i))
console.log(JSON.stringify(all))
Three Level 1 events that Level 2 does not have
- navigationStart: the leftmost point of the original diagram. The Level 2 spec says under this attribute that it "is not defined for
PerformanceNavigationTiming" and that authors should usetimeOrigininstead (spec). The reason is that Level 2 changed clocks. Every value in Level 1'sperformance.timingis an absolute timestamp in milliseconds since 1970, so a stage's length only appears after you subtract two of them. Level 2 uses HR-TIME'sDOMHighResTimeStamp, where every value is relative to the time origin, the moment navigation started (hr-time). W3C gives two reasons: an absolute clock likeDate.now()can go backwards when the system clock is adjusted, and it only resolves to a millisecond; a relative value comes from a monotonic clock, never goes backwards, and resolves below a millisecond. So navigationStart did not disappear; it became the 0 ofstartTime. The other names did not change. - domLoading: Level 1's mark for when the parser started. In 2015, issue #13 on w3c/navigation-timing proposed dropping it: Chrome creates the Document before the response begins, IE when the response starts, Firefox after buffering some of the response, so domLoading measures each browser's internal implementation and is of no use to a page author. The outcome was a deprecation note in the spec, "due to differences in when a Document object is created in existing user agents, the value returned by domLoading is implementation specific and should not be used in meaningful metrics" (spec), and
PerformanceNavigationTimingleft it out. The closest value isresponseEnd. - Prompt for unload: the
beforeunloaddialog before leaving the previous page. Level 1 definesnavigationStartas the moment right after the browser finishes prompting to unload the previous document (spec), and Level 2's time origin is likewise the moment navigation starts, so the dialog sits before the clock starts and neither version has a timestamp for it. The Level 1 diagram draws the box only to show what happens before the start.
fetchStart itself is taken just before the HTTP cache check. Between startTime and fetchStart sit unload and redirect, 0.6 ms on this load.
References
- Navigation Timing, W3C Recommendation, 2012-12-17. Level 1, where the original diagram comes from; the image is timing-overview.png.
- Navigation Timing Level 2, W3C Working Draft. The current spec; its processing model defines when each timestamp is taken.
- PerformanceNavigationTiming on MDN. Every property, with a diagram of the order they fire in.
- Performance.timing on MDN. The deprecated Level 1 interface, kept here for reading old diagrams.
- The script element on MDN. When a plain,
async, ordeferscript runs. - Towards HTTPS by default, Chromium Blog, 2023-08-16. The announcement of Chrome upgrading http to https on its own.
- Measure the Critical Rendering Path on web.dev. The same subtractions, applied to the first render.